Last updated: 2025-11-30
Using the Dashboard Quick Review Report
The Quick View Report gives you statistical information about your database and helps you measure your productivity. The Quick View Report appears only on large-screen devices.
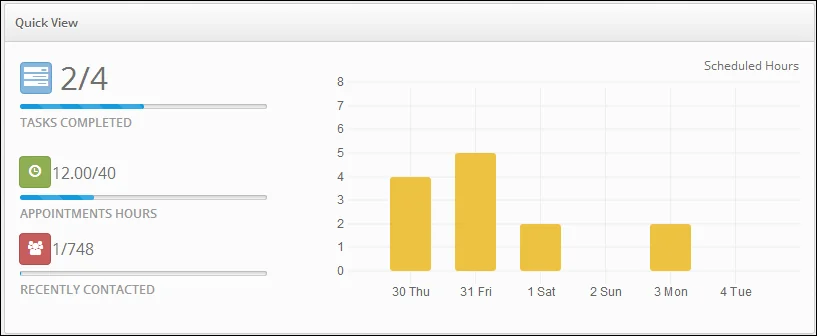
Tasks Completed This progress bar shows the number of tasks you have completed today out of the total number of tasks for the day.
Appointments Hours
This progress bar shows the total number of activity hours, excluding all-day and task activities, that you have scheduled for the week out of the total available hours (the chart assumes a 40-hour week).
Recently Contacted This progress bar shows the percentage of your contacts whose Last Contacted date falls within the past 30 days.
Scheduled Hours This graph shows the number of activity hours you have scheduled for today and the next five days, excluding all-day activities and tasks.
Recent Correspondence This graph shows the amount of correspondence you have sent during the current month and the previous five months.
Review Dates This graph shows the number of contacts with review dates that fall within the current month as well as each of the next five months.