Last updated: 2025-09-19
SmartInvestments - Performance Calculations
- Overview
- Requirements
- Investment Account Setup for Performance Calculations
- Excluding an Account, Position or Security from Performance Calculations
- Running Performance Calculations
- Viewing Performance Results
- How Performance is Calculated
- Term Definitions
- Time-Weighted Rate of Return Calculation (Modified Dietz Method)
- Linking Rates of Return
- Comparative Index Calculations
- Blended Index Calculations
- Examples of Transactions Processed during Performance Calculations
- Calculations of Two Different Positions in the Same Security Type
- Annualizing Rates of Return
- Performance Reports
Overview
The performance calculations feature of SmartInvestments enables the advisor to view a client's investment returns and compare the returns to those of various market indices.
 Watch the Training Class: Performance Overview
Performance calculations must be run once a month to reflect the account transactions that occurred through the prior month. These calculations can be rerun as often as necessary any time of the month, quarter, year, etc. In addition to calculating investment performance, the user can generate a variety of performance reports based on the performance records created from the calculations.
To achieve accurate results, ensure that position transactions are up to date before running performance calculations.
Note: Performance is not calculated for personal holdings (bank accounts, real estate, notes receivable and personal property).
Advisors can use SmartOffice's performance calculation capabilities to help them achieve compliance with Global Investment Performance Standards (GIPS) for fair representation of investment performance to clients.
Requirements
To use performance calculation features, the SmartInvestments user must have the Performance Calculations license enabled in User Accounts - User Rights.
Investment Account Setup for Performance Calculations
- Search for the client's contact record.
- Tag the contact record in the search results list or open the record.
- Click the Investment Accounts tab.
- Open an investment account's Account Performance content link.
- Configure the settings in the Performance Dates section:
- Initial Performance Date: This is the date from which performance will be calculated for the account. When monthly time-weighted rate of return (TWRR) performance records are generated, the date of the first record is the month-end prior to this date. By default, the initial performance date is the same as the open date on the Account Detail content link. If the account has no open date, the initial performance date defaults to the current date. The user may enter any date on or after the account open date. The date can be any day of the month, including month-end, but it is normally a business day or trading day and not a weekend or holiday. If the account open date is modified, the system does not automatically update the initial performance date; the advisor must change the initial performance date manually.
Tip: A fast way to update the initial performance date of multiple investments accounts at once is to tag those accounts in the Investment Account List and then select Menu > Update Initial Performance Date. Note that an account must already have an initial performance date for this feature to work; this method does not create initial performance dates for accounts that do not already have them.
- In the Index List section, specify the market indices against which the account's performance is to be compared (indices are created in the Investment Securities area of SmartInvestments):
- Add indices by selecting Options > New 'Index' record, tagging one or more indices in the Indices Available dialog box and then clicking the OK button. Although there is no limit to the number of indices that can be selected, some Performance Reports display only the first five indices in the Index List due to space limitations. - Delete indices from the list by tagging them, clicking the Options button
 and selecting Delete 'Index' record.
- Repeat the preceding steps for each of the client's accounts.
Excluding an Account, Position or Security from Performance Calculations
To exclude an investment account (e.g., a closed account), position or security from performance calculations, select the Exclude from Performance option on the Account Detail content link, Position Detail content link or security Detail content link. This tells SmartOffice not to calculate performance for the account, position or security and to exclude it from aggregate performance calculations at the contact and household levels.
To change the Exclude from Performance option for multiple records at once, tag those records in a list, and then select Menu > Advanced Options > Update Exclude from Performance. Note that this command does not work on comparative index and blended index security records.
Note: After changing the Exclude from Performance option, the user must run performance calculations to ensure that returns are presented accurately.
There may be instances in which the user does not want to remove the ability to calculate performance for an account by selecting its Exclude from Performance option but still wants to calculate aggregate performance for a contact or household without including the account in those calculations. To accomplish this, the user can create an account group that includes all of the contact's or household's accounts except for the account to be excluded, then run performance calculations on that account group.
Running Performance Calculations
- Calculations for each position in an account begin on the month-end date prior to the earliest position transaction.
- Performance calculations can be run at the household, contact, account or account group level. If they are run at the contact or account level, calculations occur at both levels. However, household and account group performance calculations can be run only at the household and account group levels.
- Performance calculations can be run for multiple accounts, contacts or households. The speed of the utility depends on the number of accounts being processed and the number of years of performance data being calculated.
To run performance calculations:
- Do one of the following:
- For investment accounts: Open an account's Account Performance content link or tag one or more accounts in the Investment Account List. Then select Menu > Performance Calculations.
Alternatively, select Investments > TWRR Performance Calculation Utility from the side menu, select the Use search criteria to run for selected records option, select Investment Accounts, click the OK button, and then search for and select the accounts. - For contacts: Open a contact's Performance content link or tag one or more contacts in the Contact List. Then select Menu > Performance Calculations.
Alternatively, select Investments > TWRR Performance Calculation Utility from the side menu, select the Use search criteria to run for selected records option, select Contacts, click the OK button, and then search for and select the accounts. - For households: Open a household's Performance content link or tag one or more households in the Household List. Then select Menu > Performance Calculations.
Alternatively, select Investments > TWRR Performance Calculation Utility from the side menu, select the Use search criteria to run for selected records option, select Household, click the OK button, and then search for and select the accounts. - For account groups: Open an account group's Group Performance content link. Then select Menu > Performance Calculations.
Alternatively, select Investments > TWRR Performance Calculation Utility from the side menu, select the Use search criteria to run for selected records option, select Account Group, click the OK button, and then search for and select the accounts. - For all records: Select Investments > TWRR Performance Calculation Utility from the side menu. Then select the Run Performance Calculation Utility for entire office option and click the OK button. For performance reasons, this method processes calculations overnight using the Job Queue instead of processing them in real time. In addition, this method does not present the user with a list of missing prices necessary to produce accurate time-weighted rate of return values.
- Select the appropriate options in the Run Performance Calculations From dialog box.

- Last Performance Date: Select this option to calculate performance after position transactions are posted and prices are updated. This option calculates performance since the date of the latest performance record.
- Initial Performance Date: Select this option to calculate performance from the account initial performance date (or the contact/household's first performance date) through the current month-end. This option is useful the first time performance calculations are run for an account or a contact/household, or when transaction or position history has been altered. After running performance calculations using this option, select the Last Performance Date option for subsequent performance calculations.
- After selecting an option, click the OK button.
- If any prices are missing from the price histories of any securities, a list of missing prices displays (this does not occur if performance calculations are run from the side menu). For performance calculations to be accurate, month-end prices for all securities must be present in the system. Although calculations can be run without the missing prices, this is not recommended, as it may result in inaccurate calculations. For more information, see Updating Security Prices. The Missing Prices utility includes missing value/return dates for any comparative and blended indices listed on the Performance content link of a contact.
Note: If performance calculations are run for all records, results are not immediately available. Instead, the request is sent to the Job Queue for processing.
Viewing Performance Results
After running performance calculations, go to the following locations to view the results:
- Households: Go to the Performance content link. Results for all household members' accounts are displayed in the Household Performance section.
- Contacts: Go to the Performance content link. Results for all of the contact's accounts are displayed in the Contact Performance section.
- Investment Accounts: Go to the Account Performance content link. Results for that account are displayed in the Account Performance section.
- Positions: Go to the Position Performance content link. Results for that position are displayed in the Investment Position Performance section.
In each area, the list displays performance calculation records with columns for each market index selected during account setup for comparison. As with other lists in SmartOffice, the layout of this list can be customized.
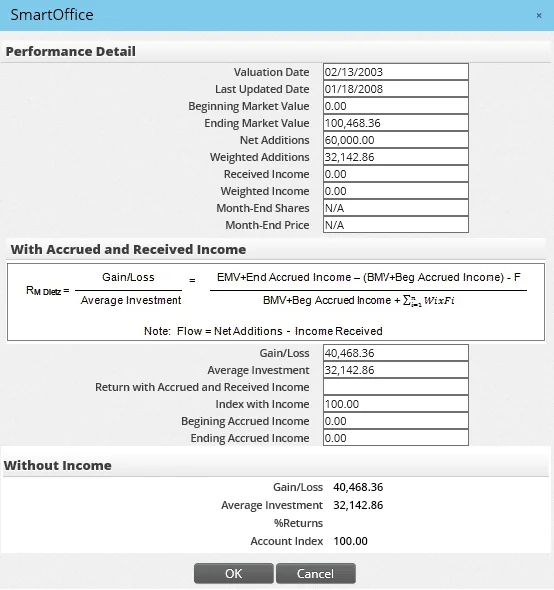
Click the first-column hyperlink of any record (the date, by default) to see the return calculations.
In addition, running performance calculations updates the following fields on the Account Performance content link and the contact/household Performance content Link are updated:
- Last Performance Date: This field specifies the last month-end for which performance was run. Whenever performance calculations are run, this field is automatically updated with the date of the last performance record.
- Last Updated Date: This field specifies when performance calculations were last run. Each month's performance record contains a Last Updated Date. There is also a corresponding Last Updated Date field/column for use in lists and reports. The date a record was last updated is important for rebalancing and auditing purposes.
How Performance is Calculated
Performance calculations in SmartOffice use the Modified Dietz Method with accrued and received income.
| RM Dietz \= | Gain/Loss | \= | EMV \+ End Accrued Income − (BMV \+ Beg Accrued Income) − F |
|---|---|---|---|
| Average Investment | BMV \+ Beg Accrued Income \+ Image from formula.gif |
Rates of return are time-weighted and geometrically linked on a monthly basis. Therefore, a return is calculated for each month based on the transactions or position history, and those monthly returns are multiplied (or chain-linked) to calculate a return for a specified period.
Accrued income is included in the calculations when ex-dividend data is present.
Beginning accrued income is added to the beginning market value (BMV), while ending accrued income is added to ending market value (EMV). The Ex Div. Date field in the Transaction dialog box for the Dividend, Interest, Capital Gain and Distribution transaction types must have a date entered in order for the transaction to be processed and given the credit at the correct time. If the field is blank, the transaction is processed by the trade date when the income is received, i.e., the transaction is processed as though accrued income was not included.
Term Definitions
- Account Index Value with Accrued and Received Income: The starting index of any account is 100\. As more valuations are stored, the return from each period is linked to the previous index value to generate a cumulative value to calculate a cumulative return.
- Amount Gain/Loss with Accrued and Received Income: This is the sum of both realized and unrealized gain/loss for the month. Divide this amount by the average investment to get a total return for the monthly period.
- Average Investment with Accrued and Received Income: This is how much was invested on average at each valuation. Normally, it would be the beginning market value plus the total contribution during the month. However, because the calculation is time-weighted and includes accrued income, weighted contributions are used in addition to including accrued income.
- Beginning Market Value: The prior month's ending market value. When no performance record for the prior month exists, beginning market value is calculated as:
Cumulative shares of current month × price available in price history × price factor of security
- Beginning Price: The price value from the linked security’s price history for the last business day of the month preceding the month-year above. If no price record exists for this date, the next earlier price is used. If no earlier price exists, the beginning price is zero.
- Beginning Shares: The share value from Data for Reports as of the last business day of the month preceding the month-year above.
- Calendar Days for Weighted Income and Weighted Additions: This is (CD − D)/CD, where CD is the number of calendar days in the performance month and D is the transaction date.
- Ending Market Value: At the position level, this is Ending Price × Ending Shares × Price Factor. At the account level, this is the cumulative sum of the ending market value of each position linked to the account. At the contact level, this is the cumulative sum of the ending market value of each position linked to the contact. At the household level, this is the cumulative sum of the ending market value of each position linked to the household. At the account group level, this is the cumulative sum of the ending market value of each position linked to the account group.
- Ending Price: The price value from the linked security’s price history for the last business day of the month-year above. If no price record exists for this date, the next earlier price is used. If no earlier price exists, the ending price is zero.
- Ending Shares: The share value from Data for Reports as of the last business day of the month-year above
- Flow: Flow (F) is net additions less income received.
- Income Received: The summed value of cash income transactions (i.e., Cash Dividend, Cash Interest, Cash LTCG, Cash STCG, Cash Distributions). This value does not include reinvested income transactions. This value is subtracted from net additions to derive flow, which is used to calculate gain/loss.
Note: When the transaction date is after the position liquidation date, the cash distribution is included in income received in the month the position was liquidated.
- Net Addition: The net value of transactions investing in the position (i.e., Buy, Miscellaneous, Security
- In, Undefined) less transactions withdrawing from the position (i.e., Sell, Fee, Principal, Security - Out, Liquidate). Income received is subtracted from this value to derive flow, which is used to calculate gain/loss.
- Percent Return: Percent return is a measurement of how well an investment performed, taking into consideration price fluctuation, dividends, interests and capital gains.
- Weighted Addition: The time-weighted net value of transactions investing into or withdrawing from the position (i.e., time-weighted net additions). It is "weighted" in that transactions that occur earlier in the month-year have greater proportional impact. Weighted income is subtracted from this value to derive the summed weighted flow of average investment (∑W*i* × F*i*).
- Weighted Flow: (∑W*i* × F*i*) is weighted additions less weighted income.
- Weighted Income: This is the same concept as weighted addition, except that it contains only the weightings for income received (dividend, interest, etc.). Weighted income is the time-weighted summed value of cash income transactions (i.e., time-weighted income received). This value is subtracted from weighted additions to derive weighted flow.
Time-Weighted Rate of Return Calculation (Modified Dietz Method)
Account Index Value with Accrued and Received Income
- Gain/Loss with Accrued and Received Income \= Ending MV \+ Ending Accrued Income − Beg. MV \+ Beginning Accrued Income − Flow
- Weighted Additions \= ∑ \[(days in period − trade date) ÷ days in period] × Transaction Value]. Refer to the definition of Net Additions in Term Definitions for a list of transaction types included in additions.
- Weighted Income \= ∑ \[(days in period − trade date) ÷ days in period] × Transaction Value]. Refer to the definition of Income Received in Term Definitions for a list of transaction types included in additions.
- Weighted Flow \= Weighted Additions − Weighted Income
- Average Investment with Accrued and Received Income \= Beg. MV \+ Beginning Accrued Income \+ Weighted Flow
- Percent Gain \= (Amount Gain/Loss ÷ Average Investment) × 100
- New Account Index \= Previous Account Index × (1 \+ Percent Return)
Note: The Previous Account Index (starting index) is 100\.00 for new portfolios.
Account Index Value w/o Income
- Gain/Loss \= Ending MV − Beg. MV − Net Additions − Ending Accrued Inc. \+ Beg. Accrued Inc. − Income Received
- Weighted Additions \= ∑ \[((Last day of period − trade date) ÷ days in period) × Transaction Value]
- Average Investment \= Beg. MV \+ Weighted Additions − Weighted Income − Beg. Accrued Inc.
- Percent Gain \= (Amount Gain/Loss ÷ Average Investment) × 100
- New Account Index \= Previous Account Index × (1 \+ Percent Gain)
Linking Rates of Return
To get a return with a time span greater than one month, monthly returns must be geometrically linked or multiplied for the specified period. For example, suppose the following four monthly return calculations are to be used to calculate a return for the quarter.
| Date | % Return | Account Index Value |
|---|---|---|
| 12/31/XXXX | .00 | 100\.00 |
| 1/31/XXXX | 1\.20 | 101\.20 |
| 2/28/XXXX | 2\.00 | 103\.22 |
| 3/31/XXXX | -1\.48 | 101\.69 |
If the account index values are given, the monthly returns are most likely already linked. The return is then very simple to calculate:
| Quarter Return | \= \[ (Ending Index Value ÷ Beg. Index Value) − 1 ] × 100 |
|---|---|
| \= \[ ( 101\.69 ÷ 100\.00 ) − 1 ] × 100 | |
| \= 1\.69 |
If the returns are given, the calculations proceed as follows:
- The % returns are converted to decimal form:
| 1\.20 ÷ 100 \+ 1 | \= 1\.012 |
|---|---|
| 2\.00 ÷ 100 \+ 1 | \= 1\.020 |
| -1\.48 ÷ 100 \+ 1 | \= .985 |
- The returns are then multiplied together:
| 1\.012 × 1\.020 × .985 | \= 1\.0169 |
|---|
- Subtract one and multiply by 100:
| (1\.0169 − 1\) × 100 | \= 1\.69 |
|---|
The return for the quarter is 1\.69%.
Comparative Index Calculations
Given the index value, the index return is calculated as follows: Index Return Formula \= \[((Current Index Value ÷ Previous Index Value) − 1\) × 100]
For example, consider these index values:
| Date | Index Value | Index % Return |
|---|---|---|
| 7/12/XXXX | 8,684\.53 | |
| 7/15/XXXX | 8,639\.19 | −.52 |
The calculation proceeds as follows:
| Index Return | \= \[((8,639\.19 ÷ 8,684\.53\) − 1\) × 100] |
|---|---|
| \= \[(.994779222 − 1\) × 100] | |
| \= \[−.005220778 × 100] | |
| \= −.52 |
Given the index return, the index value is calculated as follows: Note: If the beginning index value is not given, 100\.00 is used as the index base value.
Index Value Formula \= \[((Index Return ÷ 100\) \+ 1 ) × Previous Index Value]
| Index Value | \= \[((−.52 ÷ 100\) \+ 1\) × 100] |
|---|---|
| \= \[(−.0052 \+ 1\) × 100] | |
| \= \[.9948 × 100] | |
| \= 99\.48 |
Blended Index Calculations
If an investment account is comprised of different types of investments, an individual index may not provide an adequate performance comparison. In that case, different indices can be mixed so to create a blended index whose composition is comparable to that of the account.
For example, in an index with a blend of 60% S&P 500, 30% L/B GC and 10% CPI, each index has the following returns:
| Index \# | Index Name | % Return |
|---|---|---|
| 1 | S&P 500 | 12\.84 |
| 2 | L/B GC | 3\.59 |
| 3 | CPI | 1\.22 |
The return of the blended index is calculated as follows:
| Blended Index % Return | \= % of Index \#1 \+ % of Index \#2 \+ % of Index \#3 |
|---|---|
| \= .60 (12\.84\) \+ .30 (3\.59\) \+ .10 (1\.22\) | |
| \= 7\.70 \+ 1\.08 \+ .122 | |
| \= 8\.90 |
Examples of Transactions Processed during Performance Calculations
- To process a buy transaction: 100 shares of BioTech on 6/8/2005 @ $20/share.
The first record for this position is 6/8/2005 and the starting index is 100\.00\. Because there is no previous value to compare, there is no return for the first performance record. The record would be summarized this way:
| 6/8/2005 | |
|---|---|
| Market Valuation | $2,000\.00 |
| Accrued Income | 0\.00 |
| Net Additions | 2,000\.00 |
| Weighted Additions | 1,466\.67 \[((30 − 6\) ÷ 30\) × 2,000\)] |
| Income Received | 0\.00 |
| Weighted Income | 0\.00 |
| Account Index Value w/inc. | 100\.0000 |
- To process additional purchases: 50 more shares on 6/24/2005 @ $22/share, and the month-end closing price for BioTech is $24\.
Any activities after the initial trade would be included in the month-end performance record 6/30/2005\. On 6/30/2005, there is a total of 150 shares @ $24 ($3,600\) and a net addition of $1,100 (50 shares @ $22\). The performance record would be summarized this way:
| 6/30/2005 | |
|---|---|
| Market Valuation | $3,600\.00 |
| Accrued Income | 0\.00 |
| Net Additions | 1,100\.00 |
| Weighted Additions | 220\.00 \[((30 − 24\) ÷ 30\) × 1,100\)] |
| Income Received | 0\.00 |
| Weighted Income | 0\.00 |
| Account Index Value w/inc. | 122\.5225 \[(3,600 − 2,000 − 1,100\) ÷ (2,000 \+ 220\) × 100\.00] |
- To process a sell transaction: 20 shares on 7/12/2005 @ $25/share with a month-end closing price of $24\.20\. On 7/31/2005, there are 130 shares left @ $24\.20 ($3,146\.00\) and a net withdrawal of $500 (20 shares @ $25\). The performance record would be summarized this way:
| 7/31/2005 | |
|---|---|
| Market Valuation | $3,146\.00 |
| Accrued Income | 0\.00 |
| Net Additions | −500\.00 |
| Weighted Additions | −306\.45 \[((31 − 12\) ÷ 31\) × −500] |
| Weighted Income | 0\.00 |
| Income Received | 0\.00 |
| Account Index Value w/inc. | 124\.2337 \[(3,146 − 3,600 \+ 500\) ÷ (3,600 − 306\.45\) × 122\.5225] |
Effect of Accrued Income Included in Calculation
- To process a dividend: $0\.50/share with an ex-dividend date of 8/25/2005, a payable date of 9/16/2005 and an August closing price of $25\.
On 8/31/2005, there are still 130 shares outstanding @ $25/share. On ex-date 8/25/2005, $65 in dividends begin to accrue, but because dividends are not paid until 9/16/2005, there is still $65 in accrued income on 8/31/2005\. The accrued income is added into the market valuation, and the return is increased by the percent of the dividend.
| 8/31/2005 | |
|---|---|
| Market Valuation | $3,315\.00 |
| Accrued Income | 65\.00 |
| Net Additions | 0\.00 |
| Weighted Additions | 0\.00 |
| Weighted Income | 0\.00 |
| Income Received | 0\.00 |
| Account Index Value w/inc. | 130\.9074 \[((3,315 − 3,146\) ÷ 3,146\) × 124\.2337] $169 |
When the dividend is paid in September, the paid income is processed as described below (note that there was no price fluctuation). Because the dividend was accounted for in August, it is just a posting memo when it is paid in September. The amount of paid income is transferred from the Accrued Income field to the Income Received field, and the transaction is weighted accordingly.
| 9/30/2005 | |
|---|---|
| Market Valuation | $3,315\.00 |
| Accrued Income | 0\.00 |
| Net Additions | 0\.00 |
| Weighted Additions | 30\.33 |
| Weighted Income | 30\.33 |
| Income Received | 65\.00 |
| Account Index Value w/inc. | 130\.9074 |
Calculation without Accrued Income
- Using the same scenario as above—with the exception that there is no ex-dividend date (no accrued income)—the dividend is accounted for only when paid.
| 8/31/2005 | |
|---|---|
| Market Valuation | $3,315\.00 |
| Accrued Income | 0\.00 |
| Net Additions | 0\.00 |
| Weighted Additions | 30\.33 |
| Weighted Income | 30\.33 |
| Income Received | 65\.00 |
| Account Index Value w/inc. | 130\.8437 \[((3,315 − 3,146\) ÷ (3,146 \+ 30\.33\) × 124\.2337] |
Calculations of Two Different Positions in the Same Security Type
| Stocks | BioTech Mfg. | IBM | |
|---|---|---|---|
| Market Valuation | 200,000\.00 | 50,000\.00 | 150,000\.00 |
| Accrued Income | .00 | .00 | .00 |
| Net Add. | 200,000\.00 | 50,000\.00 | 150,000\.00 |
| Weighted Add. | 100,000\.00 | 25,000\.00 | 75,000\.00 |
| Income Received | .00 | .00 | .00 |
| Acct Index w/inc. | 112\.789123 | 108\.246800 | 116\.741230 |
The sums of BioTech Mfg. and IBM are displayed in the Stocks column for Market Valuation, Accrued Income, Net Addition, Weighted Addition and Income Received. However, the account indexes with income are independently calculated using the time-weighted rate of return calculation formula.
Annualizing Rates of Return
where x \= number of years Consider the following example of an Annualized Return calculation for various time periods:
| Number of Years Going Back | Date | Account Index |
|---|---|---|
| N/A | 12/31/2007 | 382\.90 |
| 1 | 12/31/2006 | 316\.70 |
| 2 | 12/31/2005 | 296\.70 |
| 5 | 12/31/2002 | 217\.50 |
| 10 | 12/31/1997 | 125\.90 |
| 11 | 12/31/1996 | 100\.00 |
Applying the formula:
| 1 year | 382\.90 ÷ 316\.70 | \= 1\.209030621/1 | \= 1\.20903062 | \= 20\.90 |
|---|---|---|---|---|
| 2 years | 382\.90 ÷ 296\.70 | \= 1\.290529151/2 | \= 1\.12601459 | \= 13\.60 |
| 5 years | 382\.90 ÷ 217\.50 | \= 1\.760459771/5 | \= 1\.11976070 | \= 11\.98 |
| 10 years | 382\.90 ÷ 125\.90 | \= 3\.041302621/10 | \= 1\.11765036 | \= 11\.77 |
| 11 years | 382\.90 ÷ 100\.00 | \= 3\.829000001/11 | \= 1\.12981610 | \= 12\.98 |
Performance Reports
Watch the Training Class: Running Performance Reports
Once performance has been calculated on the Performance content link, the user can generate a variety of PDF performance reports for distribution to clients. For more information about performance reports, see Reports.