Last updated: 2025-09-19
SmartInvestments - Reports
- Overview
- PDF Reports
- Account Reports
- Holding Statement Reports
- Investment Reports
- Transaction Reports
- Performance Reports
- PDF Report Column Reference
- Dynamic Reports
Overview
SmartInvestments users have access to a variety of flexible, informative reports.
Note: Samples of these reports are available in the SmartInvestments Sample Reports Guide.
PDF Reports
This section describes the PDF reports available to SmartInvestments users. To learn how to run PDF reports, see PDF Reports.
Note: To find out which data columns are included in each report, see PDF Report Column Reference.
Account Reports
- Account Summary: This report displays the summary values of the holding types or asset classes in an investment account. The Account Summary report has a minimum of one page and contains a section with information about the account and a pie chart, including the account values from the Account Detail content link.
- Account Detail: This report displays all of the positions within each of the holding types or asset classes in an investment account, with subtotals for each holding type/asset class. Like the Account Summary report, this report contains a section with information about the account and a pie chart, including the account values from the Account Detail content link. The Account Detail report has a minimum of two pages.
- Summary of Accounts: The Summary of Accounts lists all of the accounts currently held by a client on one page. In addition to a pie chart that shows the percentages of the account values, the report lists information from the Account Name, Account \#, Account Open Date, Account Type and Account Value fields of each investment account. When run at the household level with the Sort By Household Members option selected, the report combines all holdings in the household into a single report that is sorted, grouped and subtotaled by household member.
Holding Statement Reports
A holding statement lists all of a client's holdings sorted by asset class, with subtotals for each asset class and a total value calculation at the end. The reports can be configured to display purchase cost, initial cost or taxable cost information (or no cost information).
- Holding Statement
- By Owner
- Holding Statement
- By Primary Contact
- Holding Statement with Liabilities
Investment Reports
These reports can be sorted by asset class, holding type, account number, account type, how held, owner or investment name. They can be generated from the contact, household or global accounts and positions views. All investment reports except the balance sheet statements include pie charts.
The following investment reports are available:
- Asset Allocation: This report lists positions and their associated account numbers, costs and current values, as well as the percentage of the total current value that each position represents.
- Asset Allocation – Target vs. Actual: This report contains a graphical presentation of the amount and percentage of a client's assets that are invested in each asset class as of a certain date, along with a comparison to the target allocation. Three predefined date options—Previous Month End, Previous Quarter End and Previous Year End—are available. A fourth option, Custom, enables the user to manually enter a date.
- Balance Sheet – Bank Format: This report lists assets, liabilities and net worth. Assets are listed with investment name, how held, market value and account owner and number information. Liabilities are listed with lender name, loan number, secured by, interest, payment and current balance information. The report also displays contact occupation, age, tax ID and business contact data.
- Balance Sheet – Investment Format: This report lists assets, liabilities and net worth, as well as the percentage of liabilities to assets and the percentage of liabilities to net worth. Assets are listed with investment name, how held, account owner, account number, account type and market value information. Liabilities are listed with lender name, loan number, secured by, loan date, interest, payment and current balance information.
- Balance Sheet – Investment Format Summary: This report is similar to the Balance Sheet – Investment Format report, except that it has a fixed sorting order (by holding type and then account number).
- Change in Investment Value: This report displays the change in each investment's value over a given time period.
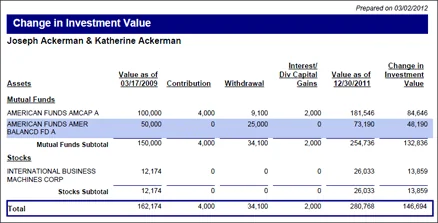
The columns are calculated as follows:
- Investment Position Summary: This report lists investment names, purchase dates, share quantities, purchase costs, current values, gain/loss amounts, current dividends, annual income, current yield percentages and the percentage that each position represents in the total portfolio.
- Investment Summary with Interest Rate: This report is like the Investment Summary with Maturity Date report, except that it adds Purchase Date and Interest Rate columns and does not have a % of Position column.
- Investment Summary with Maturity Date: This report includes investment names, account numbers, maturity dates for bonds, numbers of shares, purchase costs, current values, gain/loss amounts and the percentage of the total value allocated to each investment.
- Investment Summary with Liquidated Positions: This report is like the Investment Summary with Maturity Date report except that it displays purchase dates instead of maturity dates and includes liquidated positions.
- Investment Summary with Purchase Date: This report displays investment names, account numbers, numbers of shares, purchase dates and costs, current values, gain/loss amounts and percentages, and the percentage of the total value allocated to each investment. The gain/loss data is calculated as follows:
| Value as of | Price × Number of Shares on the specified date\*† |
|---|---|
| Contribution | Buy transactions \+ Security-In transactions‡ |
| Withdrawal | Sell transactions \+ Security-Out transactions \+ Fee transactions \+ Principal transactions‡ |
| Interest/Div/Capital Gains | Dividend transactions \+ Interest transactions \+ LTCG transactions \+ STCG transactions‡ |
| Change in Investment Value | Ending Value − (Beginning Value \+ Contributions − Withdrawals \+ Interest/Dividends/Capital Gains) |
| \* Price comes from the Price History of the security record for the given "as of" date; if no price is available for that date, SmartOffice uses the next available earlier price. †The method for calculating share value for "as of" date values differs depending on validation settings. If Roll Up: Transactions is selected, share value comes from Data for Reports, which is calculated when investment reports are run (the data itself is viewable from the Position Transactions content link by selecting Menu > Advanced Options > Data for Reports). If validation is set to something other than Roll Up: Transactions, the share value comes from the Position History content link. ‡If the Transfer option is selected on a transaction, that transaction is excluded from calculations. For more information, see Position Transactions Content Link. |
Gain/Loss% \= \[(Current Value \+ Withdrawals − Deposits) / Deposits] × 100
Buy and Sell transactions are included in the gain/loss calculation as deposits and withdrawals regardless of whether they have the Transfer option selected (for more information, see Position Transactions Content Link). If no Buy transactions (deposits) exist for a position, the Gain/Loss% column displays N/A.
- Investment Summary with Purchase Date w/o Gain/Loss %: This report is like the Investment Summary with Purchase Date report except that this report does not include gain/loss amount and percentage data.
- Position Summary: This report includes investment names, account numbers, quantity of shares, purchase cost, current value, loan balance and net equity.
- Position Summary w/out Loan Info: This report is like the Position Summary report, except that it excludes loan balance data and includes maturity dates. This report is for advisors whose clients do not have outstanding loans against their investments, as well as for advisors who do not track this information for their clients.
Transaction Reports
The investment transaction reports enable advisors to report on client investment activities such as the buying and selling of holdings (stocks, bonds, mutual funds, etc.). These reports are SEC-compliant.
- Transactions by Security: Also known as a Cross-Index or Posting report, this report displays transactions grouped by account name and number and then sorted by transaction date for a specified date range.
- Client Transaction Report: Also known as a Brokers Book report, this report displays transactions of all types for the selected client for any specified date range. Transactions are listed for all types of investments in chronological order.
- Daily Blotter: This report displays the contact's name, tax ID, account number, account name and investment name. However, because federal regulations prohibit the display of the tax ID together with the account number, the tax ID is masked (xxx-xx-xxxx). The transactions print in chronological order for any date range.
Performance Reports
After calculating investment performance, the user can generate a variety of performance reports.
Depending on the report, the user can specify a date range or an as-of date. These reports are generated with income. In addition, the option to sort data by holding types, asset class, market value, shares or returns is available.
Note: When performance reports are run for account groups, the system uses the earliest initial performance date of all accounts linked to the group.
- Annualized Return: This report displays the returns for each position and account total return, plus benchmarks for 1 year, 3 years, 5 years, 7 years, 10 years and Since Inception. All of the returns are annualized, except for the 1-year return.
- Investment Performance Summary: This report displays the client's assets sorted by holding type, asset class, account number, account type, how held, owner or investment name. The report also features a summary of contributions, withdrawals, interest/dividend/capital gains and the change in account value, as well as the aggregate returns of up to five benchmark indices that the user has designated on the Performance content link.
The columns are calculated as follows:
| Quantity | The number of shares as of the report’s Through date |
|---|---|
| Cost | The Purchase Cost, Tax Cost or Initial Cost, depending on the report options selected. Initial cost is entered manually on the Position Detail content link. Tax Cost and Purchase Cost are calculated on the Position Transactions content link. |
| Value as of | The market values at the beginning and end of the report date range. These values come directly from the corresponding monthly Performance record on the Position, Account, Contact and Household Performance content links. |
| Net Change in Value | Ending Value − Beginning Value |
| Annualized % Return | The method is Time Weighted Rate of Return. Values come from the Position Performance content link. |
The values in the summary box are calculated as follows:
- Performance Period-to-Date: This report contains the returns for each position and the account total return for the last month, last 3 months, quarter-to-date, year-to-date and the last 12 months. None of the returns are annualized, because the date range is 1 year or less.
- Performance Report: This report displays an account's beginning and ending values and summarizes the activities that took place during the selected date range. Included are contributions, withdrawals, interest, dividends and change in account value. This report displays the account's cumulative and annualized returns for the selected date range. As many as five benchmarks with returns can also be included.
- Performance Summary: This report displays the monthly and cumulative returns, market value, net additions and withdrawals for an account month by month. As many as five benchmarks can also be selected for inclusion. This report can be run at the account and position levels. At the account level, it displays the performance for the entire account; at the position level, the performance for only to the selected position is displayed. If the position/account is active for any portion of the date range specified for the report, the report reflects the rate of return of the position/account for that portion of the date range.
- Performance Summary of Accounts: This report shows all of a client's accounts, account numbers, open dates, account types, the amount in each account, and the cumulative and annualized returns for the selected period. A pie chart shows what portion of the total is invested by each account. If the position/account is active for any portion of the date range specified for the report, the report reflects the rate of return of the position/account for that portion of the date range.
- Performance Valuation Summary: This report displays all of the fields and their values in the performance table that the system uses to calculate the return on a monthly basis. If this report is printed from the Account Performance content link, account data is included. If this report is printed from the position level, only data for the selected position is included. This report can be used in an audit and analysis of the account or position returns.
- Top 10 Holdings: Only the top 10 performers in the account are listed in this report, including the market value, shares outstanding, return and annualized return for each position.
- Yearly Review: This is a client's yearly overall portfolio review. It lists all of the client's accounts and positions, displaying the date that each position was purchased and the return for each position and account. The report also contains the market value and aggregate return for the entire portfolio for the current month, the last three years, and since inception, whether it is for the contact or the household. In addition, up to five benchmark indices can be included.
| Value on | Price × Number of Shares on the specified date |
|---|---|
| Contributions after | Buy transactions \+ Security-In transactions conducted after the specified date\* |
| Withdrawals | Sell transactions \+ Security-Out transactions \+ Fee transactions \+ Principal transactions\* |
| Interest/Dividends/Capital Gains | Dividend transactions \+ Interest transactions \+ LTCG transactions \+ STCG transactions\* |
| Change in Account Value | Ending Value − (Beginning Value \+ Contributions − Withdrawals \+ Interest/Dividends/Capital Gains) |
| \*If the Transfer option is selected on a transaction, that transaction is excluded from calculations. For more information, see Position Transactions Content Link. |
PDF Report Column Reference
The following table notes which columns are available in each investment PDF report. The table can help users determine which reports contain the combination of columns that they need.
| Investment Name | Account \# | Purchase Date | Maturity Date | Quantity/Current Shares | Price | Cost | Current Value/Market Value | Gain/Loss | Gain/Loss % | Percentage of Portfolio | Current Dividend | Annual Income | % Current Yield | Loan Balance | Net Equity | How Held | Owner | Account Type | Security Type | Interest Rate | |
|---|---|---|---|---|---|---|---|---|---|---|---|---|---|---|---|---|---|---|---|---|---|
| Asset Allocation | ✔ | ✔ | ✔ | ✔ | ✔ | ||||||||||||||||
| Asset Allocation - Target vs. Actual | Shows two pie charts comparing actual % by asset class to the target % by asset class from the asset allocation model definition. | ||||||||||||||||||||
| Asset Allocation w/o Cost Column | ✔ | ✔ | ✔ | ✔ | |||||||||||||||||
| Asset Allocation with Shares and Price | ✔ | ✔ | ✔ | ✔ | ✔ | ✔ | |||||||||||||||
| Balance Sheet - Investment Format | ✔ | ✔ | ✔ | ✔ | ✔ | ✔ | |||||||||||||||
| Balance Sheet - Bank Format | ✔ | ✔ | ✔ | ✔ | ✔ | ✔ | |||||||||||||||
| Balance Sheet - Investment Format Summary | |||||||||||||||||||||
| Change in Investment Value | Shows the change in investment value over a time period, along with the breakdown of cash flow activity. | ||||||||||||||||||||
| Investment Summary with Interest Rate | ✔ | ✔ | ✔ | ✔ | ✔ | ✔ | ✔ | ✔ | ✔ | ||||||||||||
| Investment Summary with Liquidated Positions | ✔ | ✔ | ✔ | ✔ | ✔ | ✔ | ✔ | ✔ | |||||||||||||
| Investment Summary with Maturity Date | ✔ | ✔ | ✔ | ✔ | ✔ | ✔ | ✔ | ✔ | |||||||||||||
| Investment Summary with Purchase Date | ✔ | ✔ | ✔ | ✔ | ✔ | ✔ | ✔ | ✔ | |||||||||||||
| Investment Summary with Purchase Date w/out Gain/Loss % | ✔ | ✔ | ✔ | ✔ | ✔ | ✔ | |||||||||||||||
| Investment Position Summary | ✔ | ✔ | ✔ | ✔ | ✔ | ✔ | ✔ | ✔ | ✔ | ✔ | |||||||||||
| Position Summary | ✔ | ✔ | ✔ | ✔ | ✔ | ✔ | ✔ | ||||||||||||||
| Position Summary w/out Loan Info | ✔ | ✔ | ✔ | ✔ | ✔ | ✔ |
Dynamic Reports
Users can develop and define their own reports using the Dynamic Reports feature. For more information, see Dynamic Reports.
The tables that contain investment data are Account Master, Investment Positions, Position History and Investment Transaction.