Last updated: 2025-09-19
Production Dashboard
- Overview
- Setup
- User Setup
- Line of Business Setup
- Reporting Tools
- Personal/Detail Content Link
- Production Content Link
- Production Dashboard Calculator
- Dynamic Reports Production Tables
Overview
The Production Dashboard is a reporting tool that displays advisor/producer and agency/firm production statistics such as the number of cases submitted, total premiums, trends and rankings.
Setup
To enable the Production Dashboard, a SmartOffice administrator must enable the appropriate user rights, licenses and other settings described in the following sections.
For information about enabling licenses and user rights, see User Accounts.
User Setup
To enable a user to access the Production Dashboard, enable the Production Dashboard license for that user.
Line of Business Setup
Note: To configure the lines of business that the Production Dashboard tracks, the administrator must have the Pending Case & Policy Setup Administrator user right.
Establishing the correct lines of business is the key to effective production reporting. To define the lines of business that the Production Dashboard tracks:
- From the side menu, select Setup > Policy/Case Setup.
- Select the Production Dashboard Setup - LOB Options hyperlink in the left menu to open the LOB options settings.
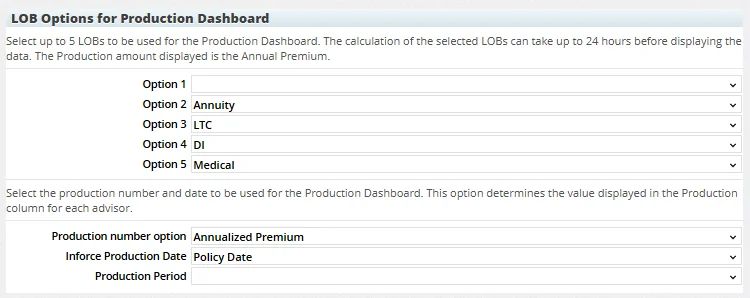
- Use the Option drop-down lists to select up to five lines of businesses to track. The options are:
- Annuity
- Auto - DI - Homeowner - Life - LTC - Medical - Other - Umbrella Note: If a line of business is selected more than once, an error message displays. Click the OK button and make new selections.
To track fewer than five lines of business in the Production Dashboard, select the blank option from one or more drop-down lists.
- From the Production Number Options drop-down list, select the number that will be used to measure production: Annualized Premium or Commissionable Annualized Premium.
- From the Production Period drop-down list, select the time period for the production statistics that display on the advisor Personal and agency Detail content links (learn more). If this field is left blank, the default production period (previous 12 months) is used.
- From the Inforce Production Date drop-down list, select the date the Production Dashboard will use to display data: Policy Date or Active Stage Date.
- Select Menu > Save.
- Click the Close button.
Reporting Tools
Several reporting components make up the Production Dashboard:
- Personal content link (advisors/producers) or Detail content link (agencies/firms)
- Production content link (advisors/producers)
- Production Dashboard Calculator
- Dynamic Reports™ production tables
These components are described in the following sections.
Personal/Detail Content Link
When a user is set up to see Production Dashboard data, the advisor/producer Personal content link and the agency/firm Detail content link display a special section on the right that contains production statistics.
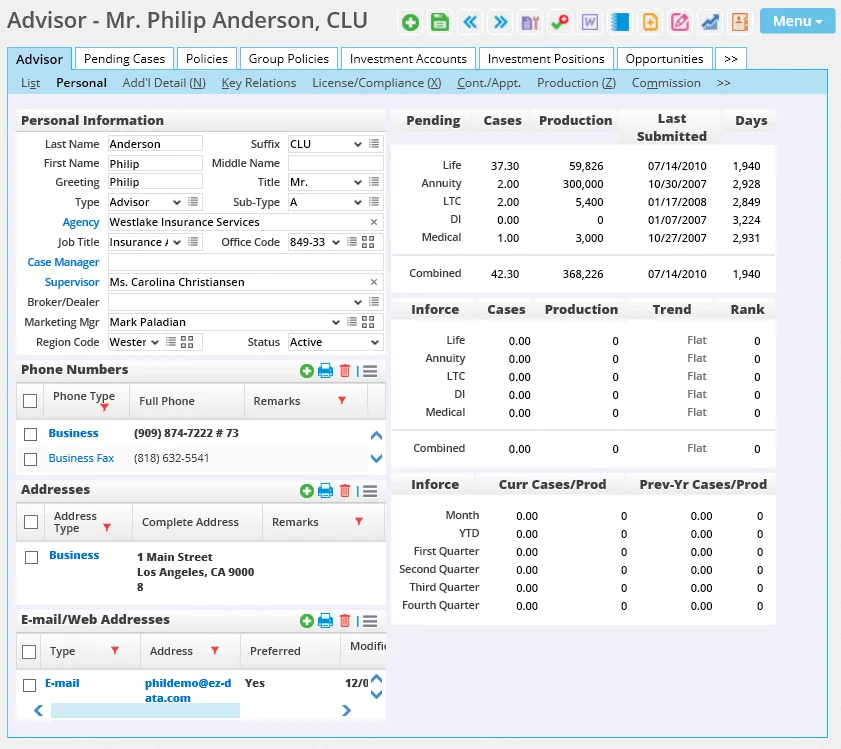
The production information is based on pending cases and policies for which the advisor is the primary advisor. The totals are updated nightly; data for any pending cases or policies created during the business day are not reflected in these figures until the next day.
By default, these statistics cover the previous 12 months. Administrators can change this time period using the Production Period drop-down list in Policy/Case Setup (see Line of Business Setup).
The Production Dashboard area contains the following sections: Pending
- Cases: The number of cases submitted for each line of business.
- Production: The total annualized/commissionable annualized premiums for pending cases submitted.
- Last Submitted: The date of the most recently submitted pending case.
- Days: The number of days since a pending case was last submitted.
Inforce
- Cases: The number of Active-status cases for each line of business.
- Production: The total annualized/commissionable annualized premiums for Active-status cases.
- Trend: This column compares the totals for the specified production period with the totals for the same preceding period. More specifically:
- If the production period is Previous 12 Months, the Trend column is calculated based on the 12-month period preceding the current 12-month period. - If the production period is Previous Year, the Trend column is calculated based on the year before the previous year. - If the production period is Year to Date, the Trend column is calculated based on the same period from the previous year.The column displays the word Increasing, Declining or Flat depending on the result of that comparison. For example, if the production period is Previous 12 months and an advisor produced $10,000 in annualized premium during that period, the system would compare the preceding 12 months' worth of annualized premium data and display the trend. If the preceding 12 months' total was $12,000 in annualized premium, the Trend column would display a value of Declining.
- Rank: This column compares the production numbers of all advisors/producers in the office and displays the individual's ranking. The same business logic is used for firm/agencies that are on the same level.
- Inforce Year to Date The bottom Inforce section is based on the policies added to the system. It does not display calculations based on pending cases.
The columns in this section are:
- Curr Cases/Prod: This column compares policy dates to the current date. Policies with dates within the past 12 months are counted in this column.
- Prev-Yr Cases/Prod: This column also compares policy dates to the current date. Policies with dates that fall within the 12-month period preceding the past 12 months are counted in this column.
Both columns display the total annualized/commissionable annualized premiums and the number of cases written during different timeframes within the specified 12-month period (month, year to date, first quarter, etc.)
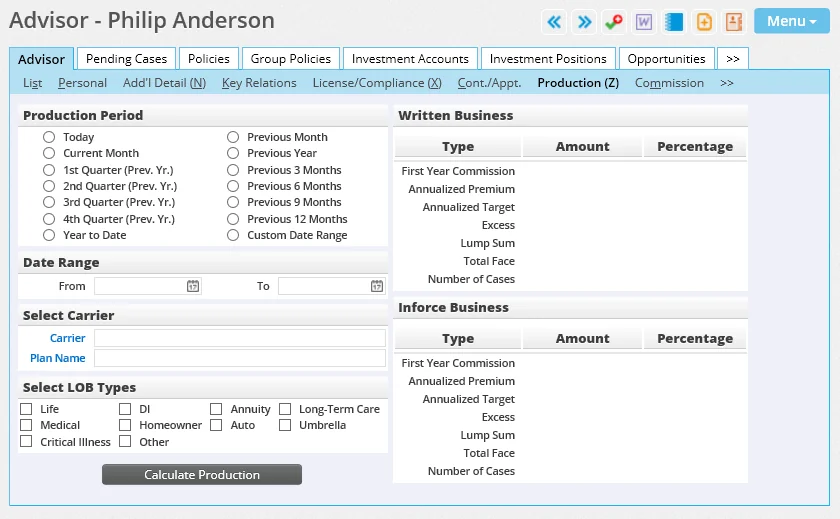
Production Content Link
The advisor/producer Production content link displays a summary of production by line of business, carriers/products and/or date ranges. To run a calculation, select the appropriate variables and then click the Calculate Production button. The results display in the Written Business and Inforce Business sections.
Production Dashboard Calculator
The Production Dashboard Calculator displays a summary of top-performing production organized by agent/broker, firm/agency, line of business, supervisor or product.
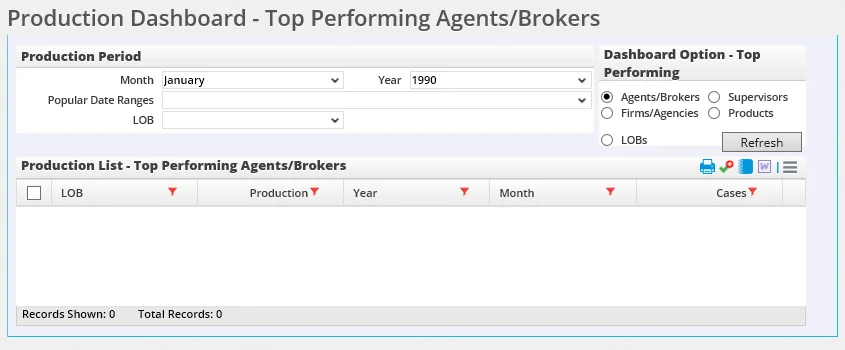
To run a calculation:
- Select Reports from the SmartOffice side menu and then select Production Dashboard from the expanded list.
- In the Production Period section, enter selections in the Month and Year fields, or select an option from the Popular Date Ranges drop-down list.
- Select a line of business from the LOB drop-down list.
- In the Dashboard Option section, select the criterion by which the summary will be organized.
- Click the Refresh button to display the results in the Production List section.
 and selecting List Options > Customize List Layout (see List Layout Customization for information about customizing lists in SmartOffice). The Options menu also features options for sending correspondence, printing the list, viewing a contact's SmartPad and more.
Dynamic Reports Production Tables
The Dynamic Report production tables are used to create a variety of fully configurable production reports.
Reporting options include the ability to display an agent's rank within the system or to view agent production for a specific line of business within an agency. Because these tasks are all performed through SmartOffice's Dynamic Reports, users can create correspondence, activities and marketing campaigns directly from these reports.
Learn more about Dynamic Reports.